Production investigation · 3 min read
Finding 16 GiB of memory the JVM couldn't account for
A production Java service used about twice its heap limit in physical memory. I traced the gap below the JVM, to glibc malloc arenas, and one environment variable fixed it.
Problem
We run a large Java service in production that moves tenant data between database clusters. It shares its host with other services, so memory it uses beyond its budget is memory those services can't have. Its Java heap was capped at 16 GiB, but the process used roughly 32 GiB of physical memory. Nothing in the JVM's own numbers explained the difference, so finding it meant going below the JVM, into how native memory gets allocated.
Context
glibc's malloc serves threads from separate memory pools called arenas, and it can create up to eight per CPU by default. Each arena reduces allocation lock contention, but its freed chunks are not necessarily returned to the operating system. A long-running, highly threaded Java process can therefore release objects while retaining physical pages in glibc.
Approach
First I tried to account for it inside the JVM
The first suspicion was an ordinary off-heap leak. I enabled -XX:NativeMemoryTracking=detail, queried it with jcmd <pid> VM.native_memory, and ran Netty with -Dio.netty.leakDetection.level=paranoid. I also capped the JDK's cached NIO buffers with -Djdk.nio.maxCachedBufferSize=262144.
Those checks did not explain the process size. Native Memory Tracking reported about 14 GiB committed while top showed 31.6 GiB RES. Direct byte buffers accounted for 944 MiB. The process had 971 threads and about 970 MiB of committed thread stacks. That is a lot of stack, but nowhere near the missing amount.
So the JVM's own accounting was consistent, and the untracked memory had to be somewhere below the runtime.
pmap exposed the malloc arenas
I used pmap -X <pid> to inspect the process mappings and grouped its anonymous 64 MiB segments. The summary contained 767 mappings attributable to glibc malloc arenas. Together they held roughly 22 GiB of RSS (resident set size, the physical memory a process holds).
The count follows from the host: on 96 cores, that default allows up to 768.
The arena count said where the memory sat, but not what was allocating it. Native Memory Tracking sees only the JVM's own allocations, so I ran async-profiler's malloc event for an hour and read the result as a flame graph. A third of all malloc samples came from one path: the service submitting MapReduce jobs, where Hadoop's job submitter copies the job's library jars through checksummed local file reads. At the bottom of that path, the JDK's FileInputStream.readBytes calls malloc for a native buffer on every read larger than 8 KB. Many threads submitting jobs meant many threads allocating and freeing short-lived native buffers at once, which is the pattern that makes glibc create more arenas.
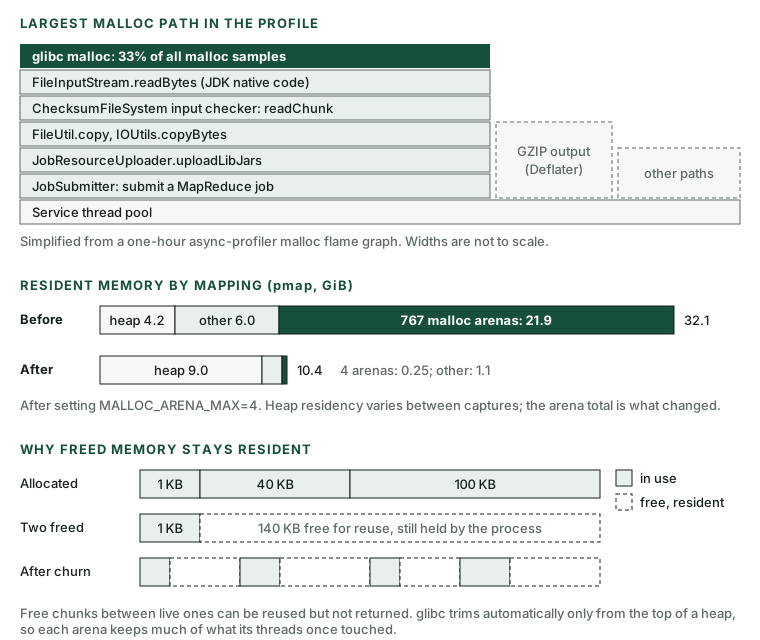
The missing memory was allocator fragmentation, so there was no live 16 GiB Java or Netty allocation to find.
Result
We set MALLOC_ARENA_MAX=4, matching the bound already used elsewhere in the Hadoop stack. In the controlled before-and-after capture, the arena count fell from 767 to 4 and process RSS fell from about 32 GiB to about 10 GiB.
The exact RSS varies with workload and heap occupancy, so I would not treat 10 GiB as a steady-state number. Native memory no longer scales with the machine's CPU count, and that part of the fix holds. We also ran jemalloc on one host before settling on MALLOC_ARENA_MAX=4.
What I would measure first now
I would put four values beside one another at the beginning of this investigation: heap committed after GC, Native Memory Tracking totals, direct-buffer usage, and process RSS. If the first three cannot explain the fourth, I would inspect mappings and allocator configuration before collecting another heap dump.
I would also record CPU count, thread count, and MALLOC_ARENA_MAX. None of them shows up in a heap histogram, and together they explained this incident.